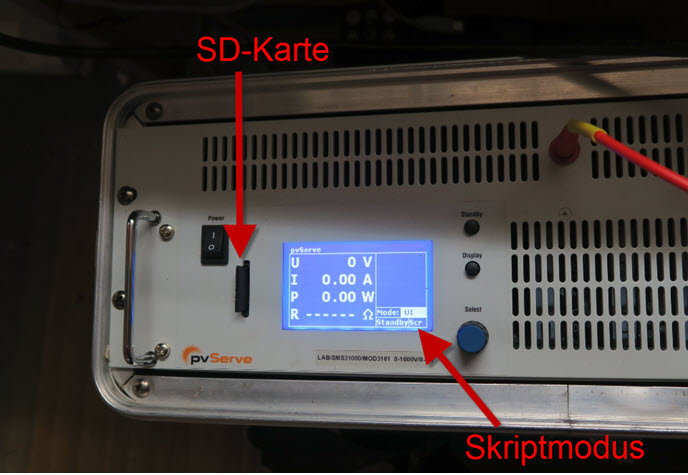
During the last quarter, we began including dark IV measurements in our testing procedure for photovoltaic systems using pvCheck. We can do this because our pvServe power supply recently gained this new measurement function, which we will be including as a standard feature from 2017. The front panel of the pvServe will have a slot to accept an SD card. The card can store scripts that allow you to measure, for example, the dark IV curves of entire solar module strings. This article will explain how it works, and what benefits it offers all those involved with troubleshooting solar power systems.
Initial considerations
It was not clear to me whether we would gain much from this new feature, but as it was available, we decided to make use of it. We therefore compared the measurement curves we obtained for each module string with the electroluminescence photographs of the same strings to see whether the dark IV curve would confirm the faults shown on the photos.
But before I get into the results, I would like to explain the procedure.
Carrying out the measurements
As you may already be aware, pvServe can be automated. In other words, all the actions that you would carry out using the controls can also be carried out automatically by means of a command script. You can easily create these scripts yourself by entering the commands in a normal text file (.txt), copying this to the SD card and inserting it into the pvServe reader. You can switch pvServe into script mode using the rotary selector on the device. When it is switched to this mode, you are able to select and run one of the scripts on the SD card. I wrote a script that sets the nominal voltage to 800V or 1000V, depending on the length of the string. The nominal current is initially set to 0A. The current is then slowly increased logarithmically at one second intervals until there is a reverse current of 4A. The device then returns to standby mode. If the memory card contains a file named Lablog.txt, all the current and voltage data supplied by pvServe is saved to this file in one second intervals while the script is running. Once you have completed your measurements, you can convert the contents of the text file into IV curves with the aid of an Excel macro written especially for this task.
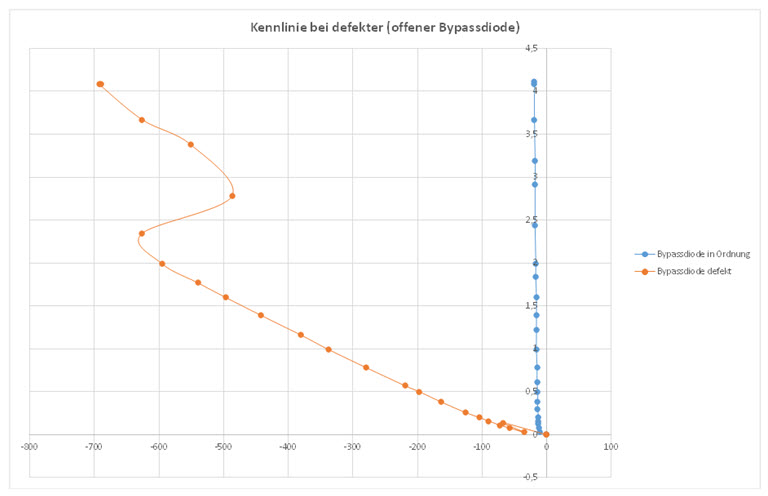
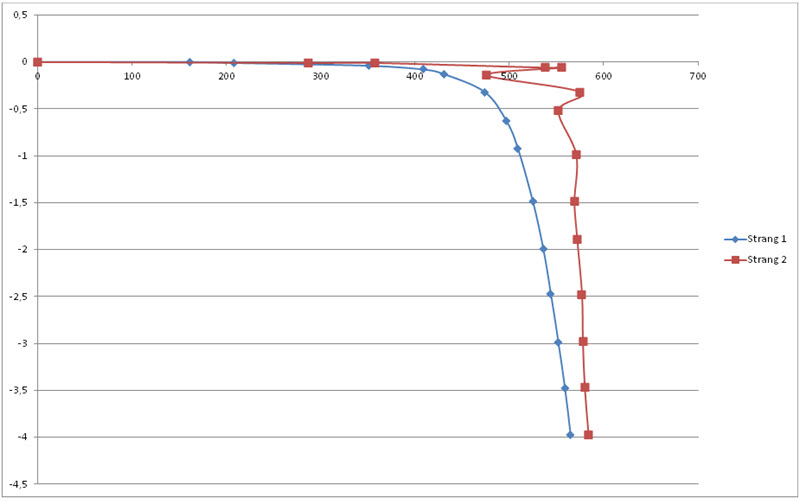
This diagram shows the results of an IV measurement of the PV system on the roof of our office building. Once you have completed the measurement, you can reverse polarity by switching plus and minus to also measure the IV characteristics of the bypass diodes. This is shown in red in the diagram below.
Measurement results

When a bypass diode fails, the curve looks like the one shown below. Here, current will only flow through the cells in the inverse direction. You need approximately 14-15V per cell for this. Please note that this operating state can destroy the solar cells. You should therefore be extremely careful and know what you are doing. I have already written in depth about bypass diode failure in this blog article.
In order to successfully deploy the measurement of dark IV curves on solar systems, I believe you should always compare the curves of several module strings with each other. Our experience over the past few months has been that the curves of good modules (of the same string length) remain very close together in the graph. Because solar radiation may be ignored as a source of interference during the night, and temperature differences in different module strings are also negligible at night, the IV curves we measure show no differences. If there is a fault in one of the module strings, however, it will show in the IV curve. This is true at least for those faults that I will now describe in more detail.
The following diagram shows the results of a measurement session in which a curve was found to deviate significantly from the norm.
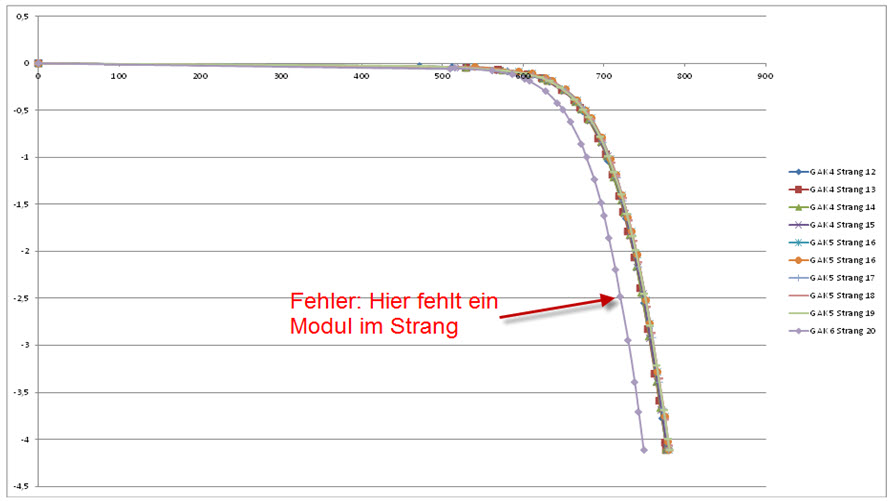
The associated electroluminescence photo reveals the cause of the deviation in the curve. Someone forgot to connect a module during installation.

In the next chart you can see a similar trend in the dark IV curve, even though there is only a 13V difference between the problem module string and the ones that are working correctly. What you are seeing on the EL photo is not a bad module, but just a faulty bypass diode.
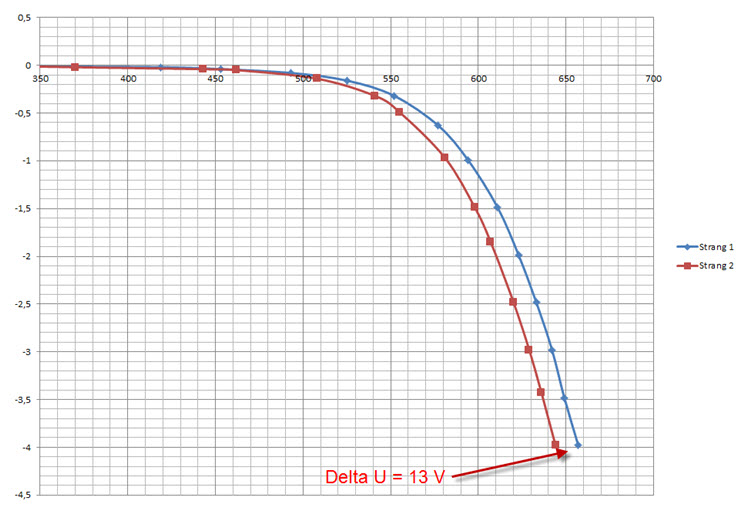
The dark IV curve of a solar module string containing a module with a faulty bypass diode.
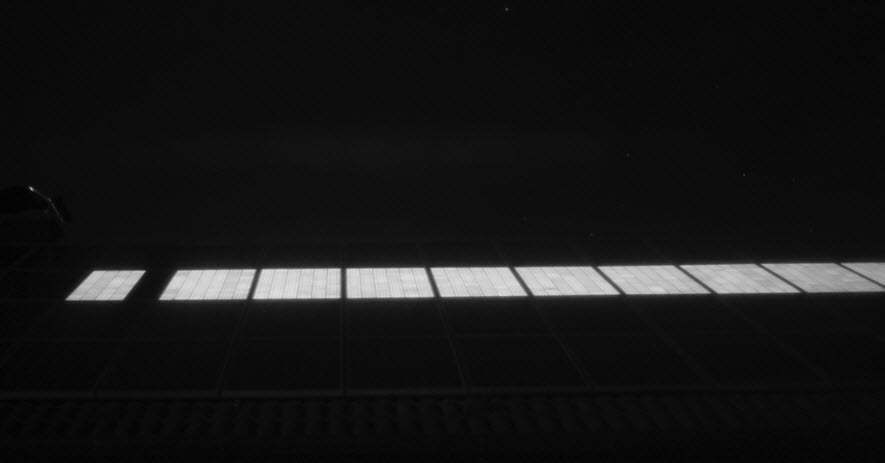
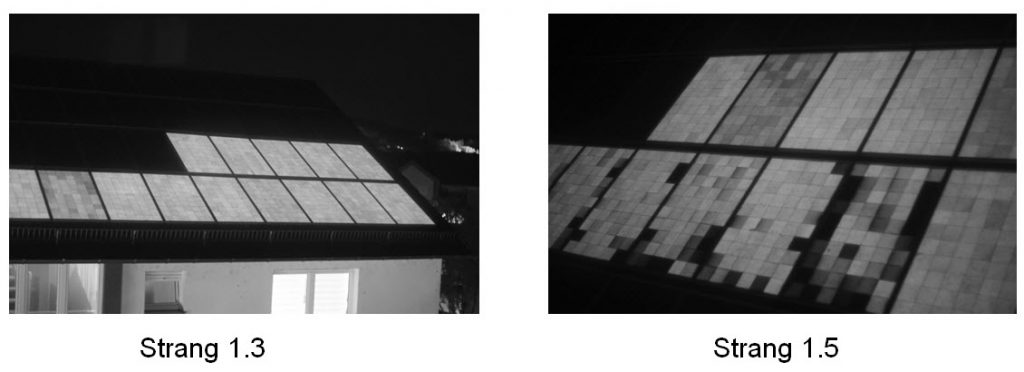
In the next example, you can see the typical curve of system operating at peak performance. You would not normally say that there is a fault condition here. However, the regular pattern of dark cells on the EL photo suggests that the module manufacturer was suffering from production problems.

The next curve shows a specific problem. As the current increases, the voltage initially rises, but then drops.
The image reveals what is causing the unusual IV curve. Arcing is taking place in a module’s high impedance cell connector.
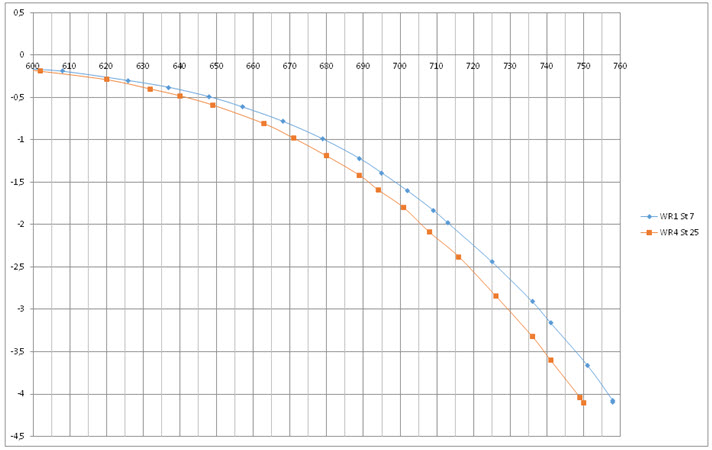
Finally, I would like to show you an interesting diagram in which the curves remain very close together at low currents and even at fairly high currents of around 4A. In between, however, there is an area where the curve (blue) pulls less power with same current. The shape of the curve is what you would expect from a low fill factor in the light IV curve.

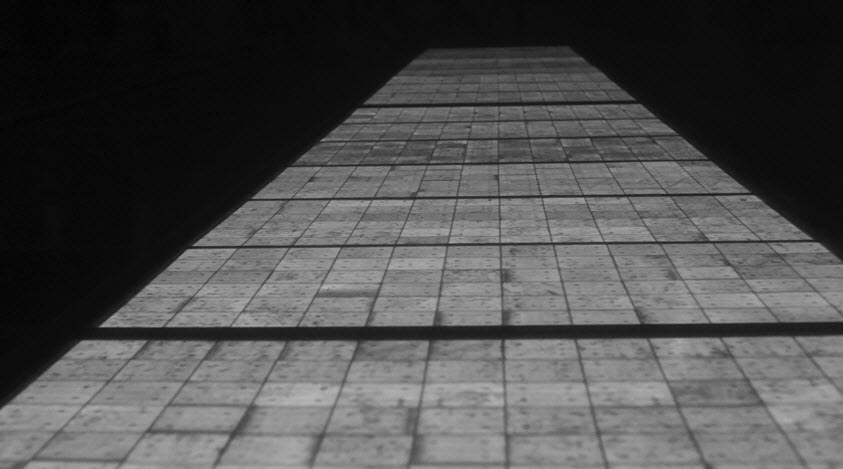
As you can clearly see in the electroluminescence photo, the suspicious module string is showing the effect of potential induced degradation (PID), something that I have discussed several times in our blog.
Conclusion
In summary, it would seem that dark IV measurements on solar generators are indeed a sensible method of identifying and pre-selecting abnormal strings when you are required to test a large number of module strings. Electroluminescence analysis then only needs to be carried out on those strings that appear “abnormal”. As a result, you should be able to check more strings during each night session without any significant reduction in the quality of the tests.
Looking ahead
We will continue to work on building up a database of typical dark IV curves while at the same time allocating typical faults to each abnormal curve. It should also be possible to define specific characteristic values, such as a dark series resistance or a dark fill factor. These values can then be obtained from each measurement and compared with each other. I expect that it would be useful to retest under exactly the same conditions using this method (irradiation = 0W/ m²) in order to detect subtle changes in the solar generators before they can lead to more serious problems, such as the development of arcing.